Published by Zhuhai Biori Biotechnology Co., Ltd.
Quantitative PCR (qPCR) is widely used in molecular biology, molecular diagnostics, gene expression studies, pathogen detection, and nucleic acid quantification. To obtain accurate and reliable results, it is essential to correctly interpret the key output parameters generated during a qPCR assay, especially the amplification curve, melt curve, and Ct value.
Understanding these core indicators helps researchers evaluate amplification efficiency, reaction specificity, and initial template quantity, which are critical for both research and diagnostic applications.
What Is qPCR Results Analysis?
qPCR results analysis refers to the interpretation of fluorescence data generated during real-time PCR amplification. By examining the shape of the amplification curve, the characteristics of the melt curve, and the threshold cycle value, users can determine whether a reaction performed properly and whether the result is reliable.
The three most important elements in qPCR data analysis are:
-
Amplification curve
-
Melt curve
-
Ct value
Each of these parameters provides different but complementary information about the PCR reaction.

Amplification Curve in qPCR
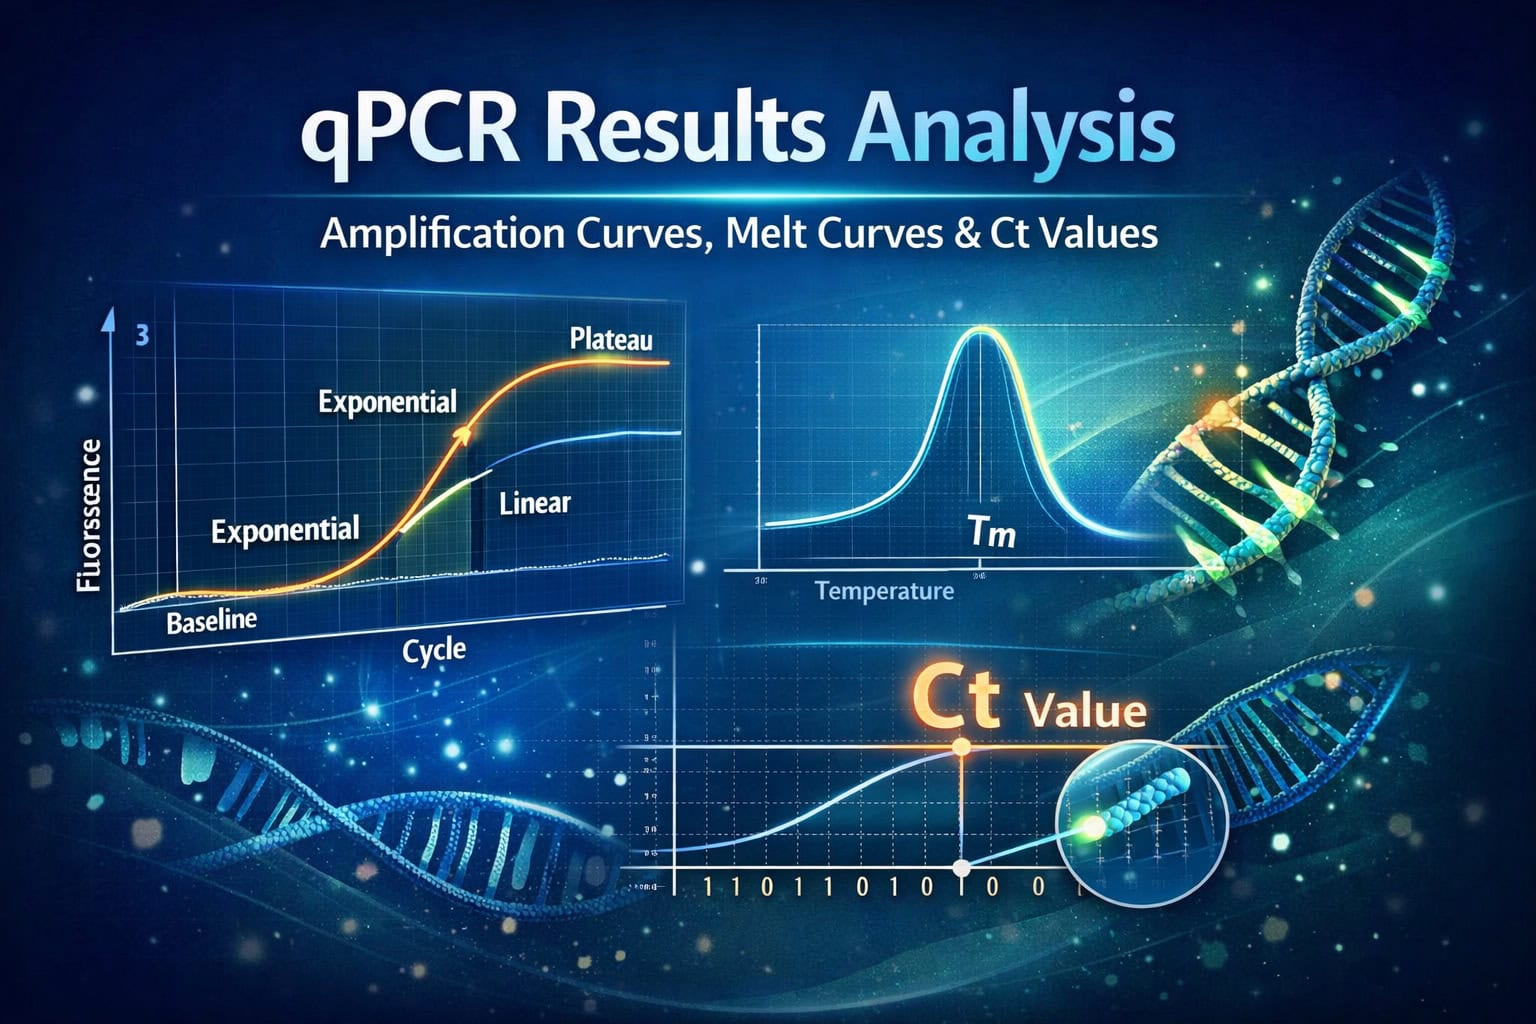
The amplification curve reflects the dynamic progression of DNA amplification throughout the PCR process. In a typical qPCR plot, the x-axis represents the cycle number, and the y-axis represents the fluorescence intensity measured in real time.
A standard amplification curve can usually be divided into four phases.
1. Baseline Phase
The baseline phase generally occurs during the first 3 to 15 cycles. At this stage, the fluorescence generated by amplified products is still too low to be distinguished from the background signal.
Because the amount of product is minimal, the reaction appears flat, and the instrument software typically uses this region to establish the baseline fluorescence level.
2. Exponential Phase
During the exponential phase, the fluorescence signal rises sharply. At this point, all major reaction components such as primers, nucleotides, and enzyme activity are still sufficient, allowing amplification to proceed at high efficiency.
This is the most important phase for quantitative analysis because the quantity of amplification product is directly related to the starting amount of template. In other words, this phase provides the most accurate reflection of the initial nucleic acid concentration.
3. Linear Phase
As the reaction continues, primers, dNTPs, and other reagents are gradually consumed. Meanwhile, amplification products accumulate, and polymerase activity begins to decline.
As a result, amplification efficiency decreases, and the fluorescence signal continues to rise but at a slower and more linear rate.
4. Plateau Phase
In the plateau phase, the amplification reaction approaches completion. The reagents become limiting, enzyme activity decreases significantly, and the fluorescence signal eventually stabilizes.
The cycle number at which the plateau begins, as well as the final fluorescence intensity, may vary depending on reaction conditions and template concentration.
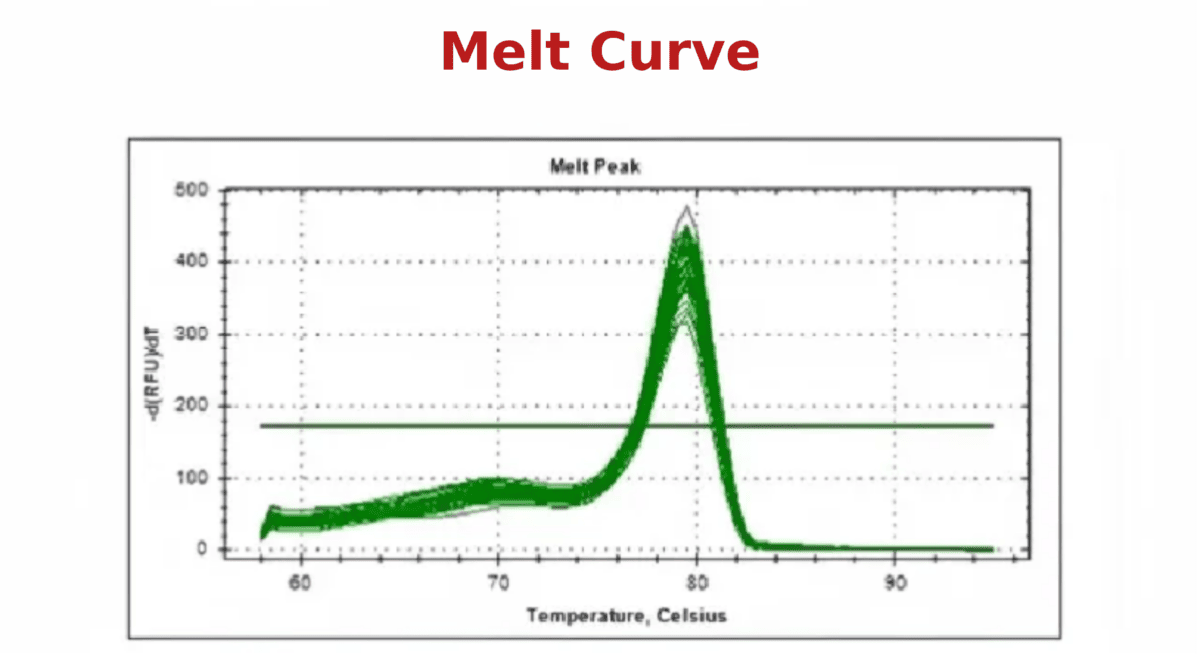
Melt Curve Analysis in qPCR
The melt curve, also known as the dissociation curve, is used to evaluate the specificity of qPCR amplification products. This analysis is especially important in dye-based qPCR assays such as those using SYBR Green.
Principle of Melt Curve Analysis
After amplification is completed, the reaction temperature is gradually increased while fluorescence is continuously monitored. As the temperature rises, double-stranded DNA (dsDNA) begins to dissociate into single-stranded DNA, causing the fluorescent dye to be released and the signal to decrease.
The temperature at which 50% of the double-stranded DNA dissociates is defined as the melting temperature (Tm).
Melt curve analysis is useful for identifying:
-
Specific target amplification
-
Primer-dimer formation
-
Non-specific amplification products
How to Interpret a Melt Curve
Single Sharp Peak
A single sharp peak usually indicates that the reaction generated one specific amplification product. In many assays, this peak is commonly observed within a characteristic temperature range depending on the amplicon sequence and length.
Small Peak Before the Main Peak
A small peak at a lower temperature may indicate the presence of primer-dimers or shorter non-specific products. These products generally melt earlier than the intended target amplicon.
Secondary Peak After the Main Peak
A secondary peak at a higher temperature may suggest the presence of non-specific amplification products with different sequence composition or longer fragment length.
Broad Peak
A broad peak may indicate mixed products or non-specific amplification products with melting temperatures close to the target amplicon. In such cases, further optimization may be necessary.
Ct Value in qPCR
The Ct value, also called the cycle threshold, is one of the most important indicators in qPCR data analysis.
What Is a Ct Value?
The Ct value is the cycle number at which the fluorescence signal first exceeds the threshold above background and becomes detectable during the exponential phase of amplification.
This value represents the point at which the amplified product can be reliably measured.
What Does the Ct Value Mean?
The Ct value is inversely correlated with the initial concentration of the target nucleic acid.
-
A lower Ct value indicates a higher initial template concentration
-
A higher Ct value indicates a lower initial template concentration
Because of this relationship, Ct values are widely used for relative and absolute quantification in qPCR experiments.
Typical Ct Value Range
Under normal assay conditions, Ct values commonly fall between 15 and 35, although acceptable ranges may vary depending on the assay design and application.
-
Ct values below 15 may suggest an extremely high template concentration or an inappropriate threshold setting
-
Ct values above 35 may indicate very low template abundance, poor amplification efficiency, or non-specific amplification
High Ct values should generally be interpreted with caution and evaluated together with amplification and melt curve data.
Why qPCR Results Analysis Matters
Accurate qPCR result interpretation is essential for ensuring reliable conclusions in applications such as:
-
Gene expression analysis
-
Pathogen detection
-
Molecular diagnostics
-
Nucleic acid quantification
-
Assay development and validation
By analyzing the amplification curve, melt curve, and Ct value together, researchers can better assess:
-
Reaction performance
-
Product specificity
-
Template abundance
-
Data consistency
-
Experimental reliability
This combined approach helps identify problems such as inefficient amplification, primer-dimer formation, non-specific products, or inconsistent sample quality.
Tips for Reliable qPCR Data Interpretation
To improve the accuracy of qPCR result analysis, it is recommended to:
-
Use properly optimized primers and reaction conditions
-
Include no-template controls and positive controls
-
Review amplification plots for abnormal curve patterns
-
Confirm specificity through melt curve analysis when applicable
-
Interpret Ct values together with overall assay performance
-
Verify reproducibility across technical replicates
Conclusion
qPCR results analysis is a critical step in real-time PCR workflows. The amplification curve reflects how the reaction progresses, the melt curve helps verify amplification specificity, and the Ct value provides insight into the starting amount of template.
A comprehensive interpretation of these three parameters allows users to identify potential issues, improve assay performance, and generate more accurate and reliable qPCR data.
FAQ
What is the amplification curve in qPCR?
The amplification curve in qPCR shows how fluorescence increases during PCR cycling as the target nucleic acid is amplified. It helps evaluate reaction efficiency and determine whether amplification occurs as expected.
What does a melt curve tell you in qPCR?
A melt curve helps determine whether the qPCR reaction produced a specific target amplicon. It can also reveal primer-dimers or non-specific amplification products.
What is a Ct value in qPCR?
The Ct value is the cycle number at which the fluorescence signal crosses the detection threshold. It is used to estimate the initial amount of target nucleic acid in the sample.
Is a lower Ct value better?
A lower Ct value usually indicates a higher starting concentration of the target sequence. However, interpretation also depends on assay design, controls, and overall reaction quality.
Why is melt curve analysis important?
Melt curve analysis is important because it helps confirm product specificity, especially in SYBR Green-based qPCR assays where non-specific products can affect data interpretation.
Related guides: PCR, qPCR, RT-PCR, RT-qPCR and dPCR comparison and PCR primer design guide.
