
Bradford Protein Assay Kit
Ready-to-use Coomassie G-250 protein assay: 3-5 min at room temperature, read at 595 nm, optimal range 100-500 μg/mL.

Product overview
Bradford Protein Assay Kit is based on the Bradford protein quantification method, which is one of the most commonly used high-sensitivity methods for protein concentration determination. Coomassie Brilliant Blue G-250 binds to basic and aromatic amino acid residues in proteins to form a blue complex with a maximum absorbance at 595 nm. Within an appropriate concentration range, the absorbance shows a good linear relationship with protein content, allowing rapid protein quantification by comparison with a protein standard curve.
Assay at a glance
| Detection | A595, microplate reader; the well without BSA is the blank control |
|---|---|
| Per well | 10 μL BSA standard or diluted sample + 300 μL Bradford Protein Staining Fluid, transparent 96-well plate |
| Incubation | Room temperature, 3-5 min; absorbance is most stable within 5-20 min |
| Optimal detection range | 100-500 μg/mL |
| BSA standards | Ready to use, no dilution: 0, 100, 150, 200, 300, 400 and 500 μg/mL (1 mL each) |
| Detergent tolerance | SDS, Triton X-100, Tween-20, NP-40 and Brij35 below 2% in the test sample |
| Storage | Bradford Protein Staining Fluid at 2-8°C; BSA standards at -20±5°C |
Protein samples lysed with RIPA lysis buffer (Strong, Medium, Weak, or the RIPA Lysis Buffer Set) can be quantified with this kit.
Features and applications
- This kit improves the traditional Bradford method and provides an optimal protein detection range of 100-500 μg/mL, together with high sensitivity and strong detergent tolerance.
- The kit is also supplied with a ready-to-use series of Bovine Serum Albumin Standard solutions at gradient concentrations, eliminating the need for dilution and making the assay convenient and efficient.
- The Bradford assay has good compatibility with most common chemicals, but elevated detergent concentrations can interfere with the result. Ensure that the concentrations of detergents such as SDS, Triton X-100, Tween-20, NP-40, and Brij35 in the test sample are below 2%.
- Biori Bradford kit showed closer agreement with the BCA method and lower relative deviations than the two other Bradford kits tested (Y and E) in 9 of the 11 clinical samples.
- Protein concentration determination in test samples.
- Quantification of cell and tissue lysates prepared with RIPA lysis buffer before Western Blot, immunoprecipitation (IP) and ELISA.
- Sample normalization before electrophoresis or Western Blot.
Protocol
Notes
- For Research Use Only. Not for use in diagnostic procedures.
- Mix Bovine Serum Albumin Standard thoroughly before use. Avoid repeated freeze-thaw cycles.
- The Bradford assay has good compatibility with most common chemicals, but elevated detergent concentrations can interfere with the result. Ensure that the concentrations of detergents such as SDS, Triton X-100, Tween-20, NP-40, and Brij35 in the test sample are below 2%.
- Precipitation may appear in the Bradford Protein Staining Fluid during low-temperature or long-term storage. If this occurs, gently invert the bottle until the precipitate is fully dissolved before use.
- Bring the Bradford Protein Staining Fluid to room temperature before use to improve assay sensitivity. Fully dissolve and mix the BSA standards before use.
- The absorbance is most stable within 5-20 min after reaction setup. Complete the measurement within this period and keep the reaction time consistent among wells to reduce error.
- It is recommended to prepare a fresh standard curve for each assay to obtain accurate results.
- For your safety and health, please wear a lab coat and disposable gloves when operating.
Assay procedure
- Add 10 μL each of BSA Standards 1-7 to a transparent 96-well plate.
- Dilute the test sample appropriately with 1× PBS or 0.9% saline (for example, 2-fold, 4-fold, or 8-fold dilution). Add 10 μL of each diluted sample to the 96-well plate.
- Add 300 μL of Bradford Protein Staining Fluid to each well, mix thoroughly, cover the plate, and incubate at room temperature for 3-5 min.
- Measure the absorbance at A595 with a microplate reader. Use the well without BSA as the blank control.
- Plot the standard curve using protein amount (μg) on the x-axis and absorbance on the y-axis. Calculate the protein content of the test sample according to the standard curve and the measured absorbance.
Troubleshooting and FAQs
Poor linearity or poor repeatability of the standard curve
Cause: Large pipetting errors, especially at low volumes; standards not fully mixed or dissolved; partial denaturation or degradation of the standards; uneven mixing between the dye and standards; inconsistent reaction times; or unstable instrument performance / incorrect wavelength setting.
Recommended solution: Use a high-precision pipette and low-retention tips; ensure the standards are fully dissolved and properly stored; mix the BSA standards and Bradford Protein Staining Fluid thoroughly; read within 5-20 min using consistent timing; and calibrate the instrument while confirming that the wavelength is set to 595 nm.
Absorbance is too high (outside the standard-curve range)
Cause: The protein concentration of the sample is too high, or the sample contains interfering substances.
Recommended solution: Dilute the sample with the same buffer as the sample matrix or with water so that the final concentration falls within the standard-curve range. Record the dilution factor for the final calculation.
Absorbance is too low (close to or lower than the blank)
Cause: The protein concentration is too low; interfering substances are present; the reaction time is insufficient or excessive in some cases; or pipetting errors have reduced the sample volume actually added.
Recommended solution: Concentrate the sample if necessary, for example by vacuum concentration or TCA precipitation followed by re-dissolution; increase the sample volume appropriately, but keep it within approximately 10-20% of the reagent working volume; and ensure sufficient but not excessive reaction time. In most cases, color development is basically stable at 5 min and is optimal at 10-20 min.
Poor repeatability between samples
Cause: The sample itself is not homogeneous, such as cell lysate containing sediment; pipetting is inconsistent, especially for viscous samples; bubbles are present in the wells; or the levels of interfering substances vary between samples.
Recommended solution: Mix the sample thoroughly by vortexing or repeated pipetting before loading, especially if sediment is present; use a positive-displacement pipette or low-retention tips for viscous samples; avoid generating bubbles after adding the dye or allow bubbles to dissipate before reading; and keep sample preparation conditions as consistent as possible.
Interference from other substances
Cause: The Bradford assay is sensitive to multiple interfering substances, which may cause abnormal increases or decreases in absorbance.
Recommended solution: Dilution can reduce the concentration of interfering substances, but the post-dilution protein concentration must remain within the measurable range. When necessary, use desalting columns, ultrafiltration devices, or dialysis to exchange the sample into a low-interference or interference-free buffer such as water or low-concentration PBS. Protein precipitation methods such as TCA / acetone can also be used to remove interferents, followed by re-dissolution in a Bradford-compatible buffer. If the interferents are difficult to remove and severely affect the result, consider switching to BCA, Lowry, or UV absorbance at A280. If the major interferent composition and concentration are known and stable, prepare standards containing the same interferent concentration to generate an interference-matched standard curve.
Abnormal color development (non-typical blue color)
Cause: The dye has deteriorated; the sample pH is extremely acidic or alkaline; strong oxidizing or reducing agents are present; or the protein concentration is excessively high, leading to precipitation or distorted color development.
Recommended solution: Check the color of the dye and replace it if the batch has deteriorated; adjust the sample pH to near neutral when appropriate; and dilute the sample or remove / reduce the interfering substances as needed.
Precipitation forms during the assay
Cause: The sample has high ionic strength, contains incompatible solvents or detergents, has an excessively high protein concentration, or the dye / mixture was used at too low a temperature, which may lead to phosphate precipitation.
Recommended solution: Dilute the sample when possible; perform desalting or buffer exchange; allow the dye and working solution to reach room temperature before use; mix thoroughly while avoiding excessive foaming; and, if necessary, centrifuge to remove the precipitate before reading the supernatant, noting that some protein may be lost with the precipitate.
Components
| Components | BR4C202-01 800 T |
|---|---|
| Bradford Protein Staining Fluid | 250 mL |
| Bovine Serum Albumin Standard (0 μg/mL) | 1 mL |
| Bovine Serum Albumin Standard (100 μg/mL) | 1 mL |
| Bovine Serum Albumin Standard (150 μg/mL) | 1 mL |
| Bovine Serum Albumin Standard (200 μg/mL) | 1 mL |
| Bovine Serum Albumin Standard (300 μg/mL) | 1 mL |
| Bovine Serum Albumin Standard (400 μg/mL) | 1 mL |
| Bovine Serum Albumin Standard (500 μg/mL) | 1 mL |
Performance data
Standard Curve
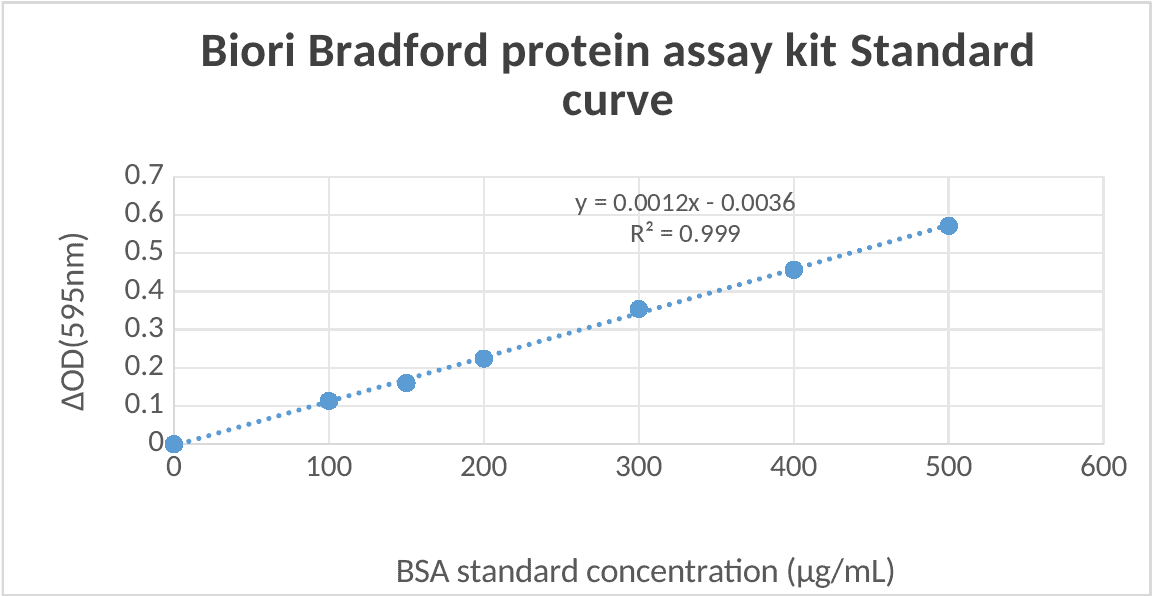
Conclusion: Biori Bradford kit showed good linearity from 0 to 500 μg/mL using BSA as the standard (R2 > 0.99).
Comparison with Other Bradford Kits and the BCA Method
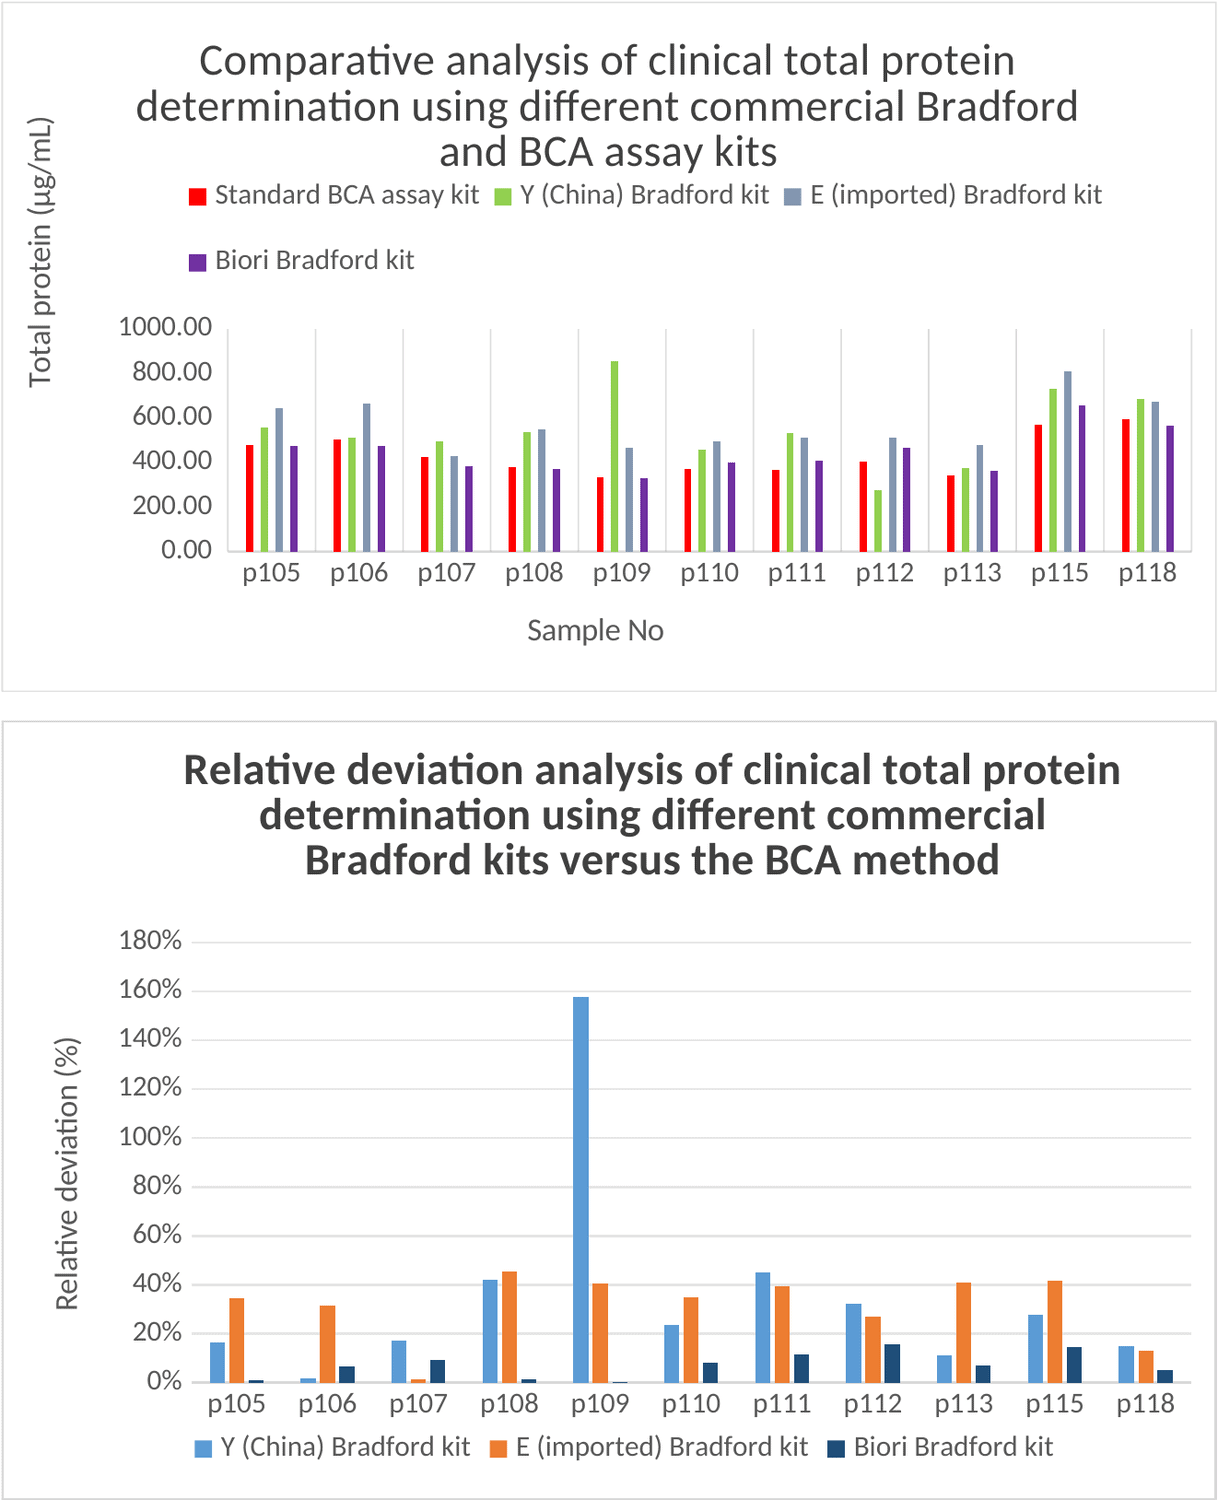
Conclusion: Biori Bradford kit showed closer agreement with the BCA method and lower relative deviations than the two other Bradford kits tested (Y and E) in 9 of the 11 clinical samples.
Shipping and storage
| Condition | Recommendation |
|---|---|
| Storage | Store Bradford Protein Staining Fluid at 2-8°C. Store Bovine Serum Albumin Standard at -20±5°C. |
| Shipping | Ship under conditions that maintain each component's specified storage condition. |
| Handling | For research use only. Review the MSDS before use. |
Downloads
Documents
BR4C202 Bradford Protein Assay Kit Instruction Manual (PDF)BR4C202 Bradford Protein Assay Kit COA (PDF)BR4C202 Bradford Protein Assay Kit MSDS 1 (PDF)BR4C202 Bradford Protein Assay Kit MSDS 2 (PDF)BR4C202 Bradford Protein Assay Kit MSDS 3 (PDF)BR4C202 Bradford Protein Assay Kit MSDS 4 (PDF)BR4C202 Bradford Protein Assay Kit MSDS 5 (PDF)BR4C202 Bradford Protein Assay Kit MSDS 6 (PDF)BR4C202 Bradford Protein Assay Kit MSDS 7 (PDF)BR4C202 Bradford Protein Assay Kit MSDS 8 (PDF)


Need this product lyophilized, in bulk, or in a custom format?
The feasibility assessment is free of charge. Send the assay brief and target format.